DMW FinTel gives in-house CFOs, VPs of Finance, and Controllers the three-statement planning suite, AI analyst, and board-ready reporting that enterprise tools promise -- at a fraction of the cost, deployed in days.
In-house finance leaders carry a different burden than their fractional counterparts: they're inside the company, accountable to the board, and expected to have answers on demand. The problem is that the tools most companies use -- cobbled-together Excel models, disconnected data sources, and overpriced enterprise software -- make "on demand" nearly impossible.
DMW FinTel is the FP&A platform your company can actually afford, deploy, and use. It delivers the three-statement planning suite, real-time dashboard, scenario modeling engine, and AI analyst that enterprise tools promise -- at a fraction of the cost, without a six-month implementation, and without requiring a team to run it. Connect your accounting platform and you're getting insights immediately. Add your revenue data, payroll export, and debt schedule, and you have a unified financial command center that answers the CEO's hallway questions in real time.
When the board meeting is in four days, DMW FinTel doesn't slow you down -- it cuts board prep time from three days to an afternoon.
Enterprise FP&A platforms built for $50M-$500M companies charge $50,000-$100,000 per year and take months to implement. They're designed for dedicated finance teams of 5-30 people with dedicated model builders. DMW FinTel delivers comparable planning depth for the $5M-$50M segment: three-statement forecasting, scenario modeling, revenue planning, debt management, and AI-powered analysis. Deploy in a day, not a quarter. Pay a fraction of the cost.
Purpose-built for in-house CFOs, VPs of Finance, and Controllers who need institutional-quality tools without an enterprise price tag.
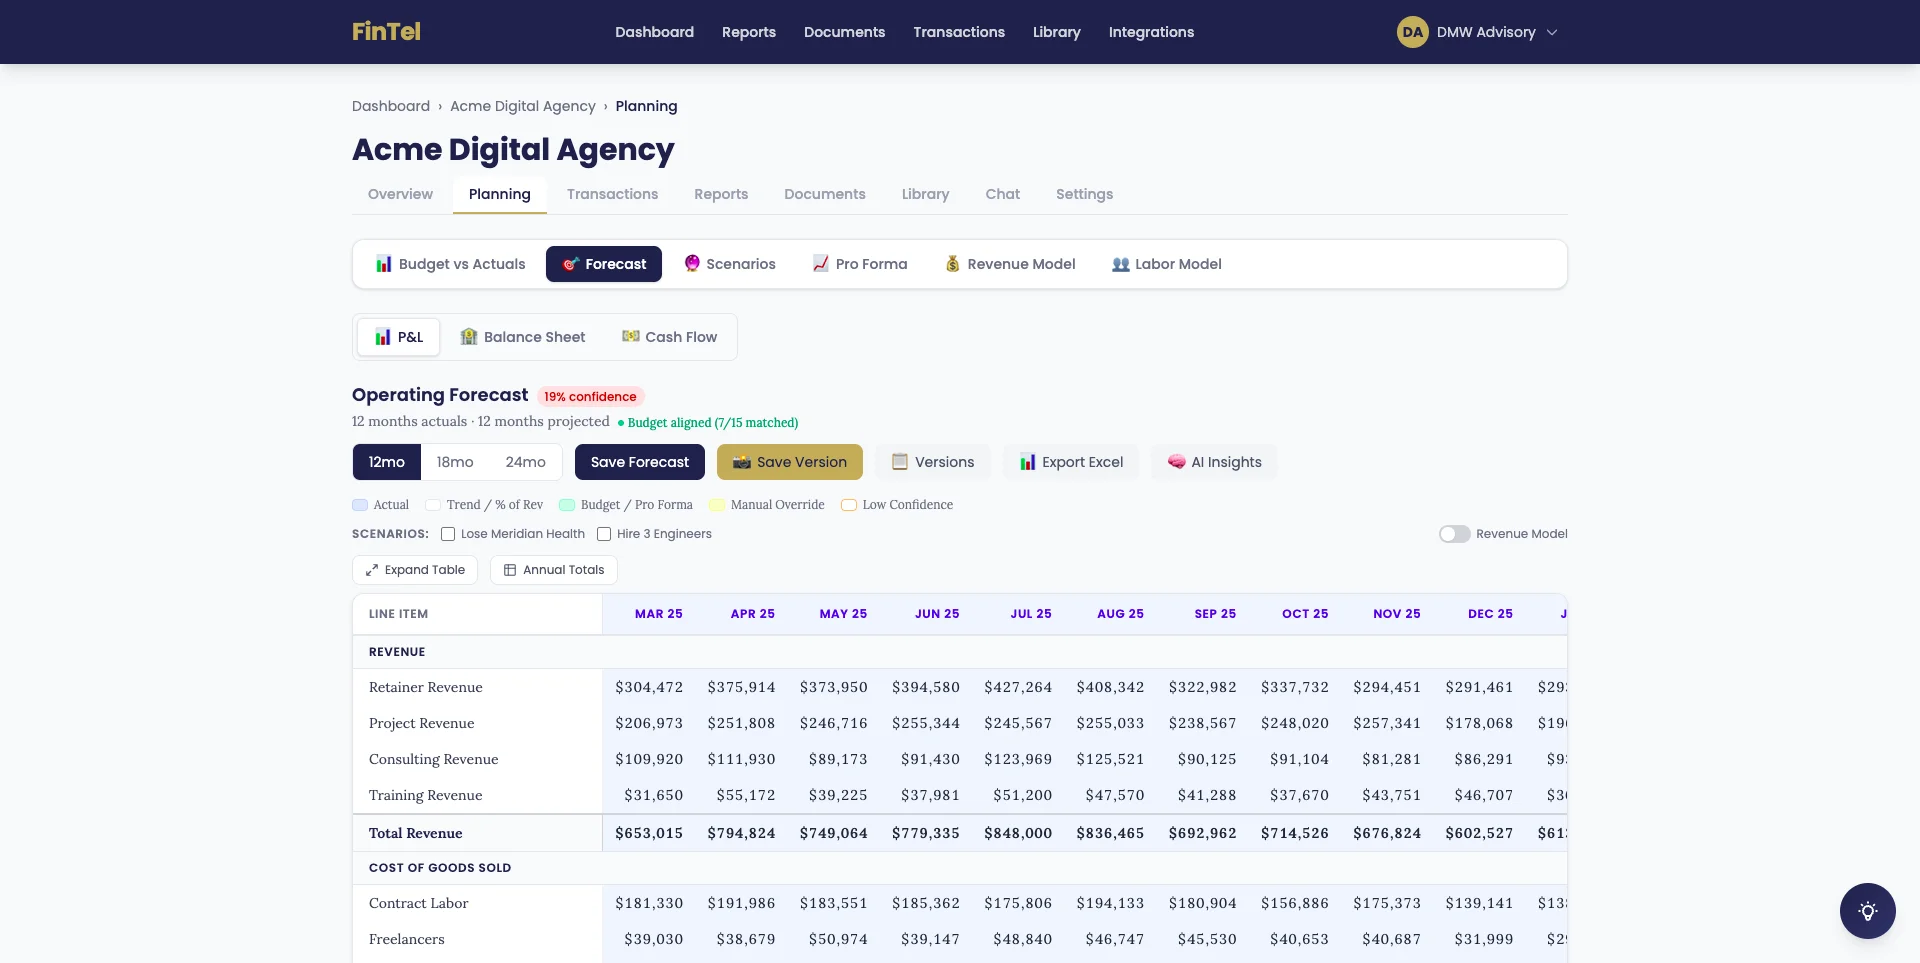
A fully integrated forecast where every statement is linked automatically. Update your revenue assumption and the P&L, balance sheet, and cash flow all recalculate instantly -- no manual tie-outs, no broken formula hunting. Build your annual plan, rolling forecast, or scenario model in the same connected environment. The three-statement model is the backbone of every analysis in FinTel.
Input your existing debt facilities -- term loans, revolving credit lines, SBA loans, convertible notes -- including amortization schedules, interest rates, and covenant requirements. FinTel tracks covenant compliance (minimum cash balance, DSCR, leverage ratio) against your live actuals and forecast. When a scenario puts you in breach territory, it flags the issue before it becomes a conversation with your lender.
Build named, persistent scenarios that update the full three-statement model in real time. "Base Case," "Upside -- Close Q3 Pipeline," "Downside -- Lose Top Client," "Cost Reduction -- Freeze Hiring." Toggle between them, compare outcomes side by side, and share specific scenarios with the board without exposing the full model. No more one-off models built under pressure for a single meeting.
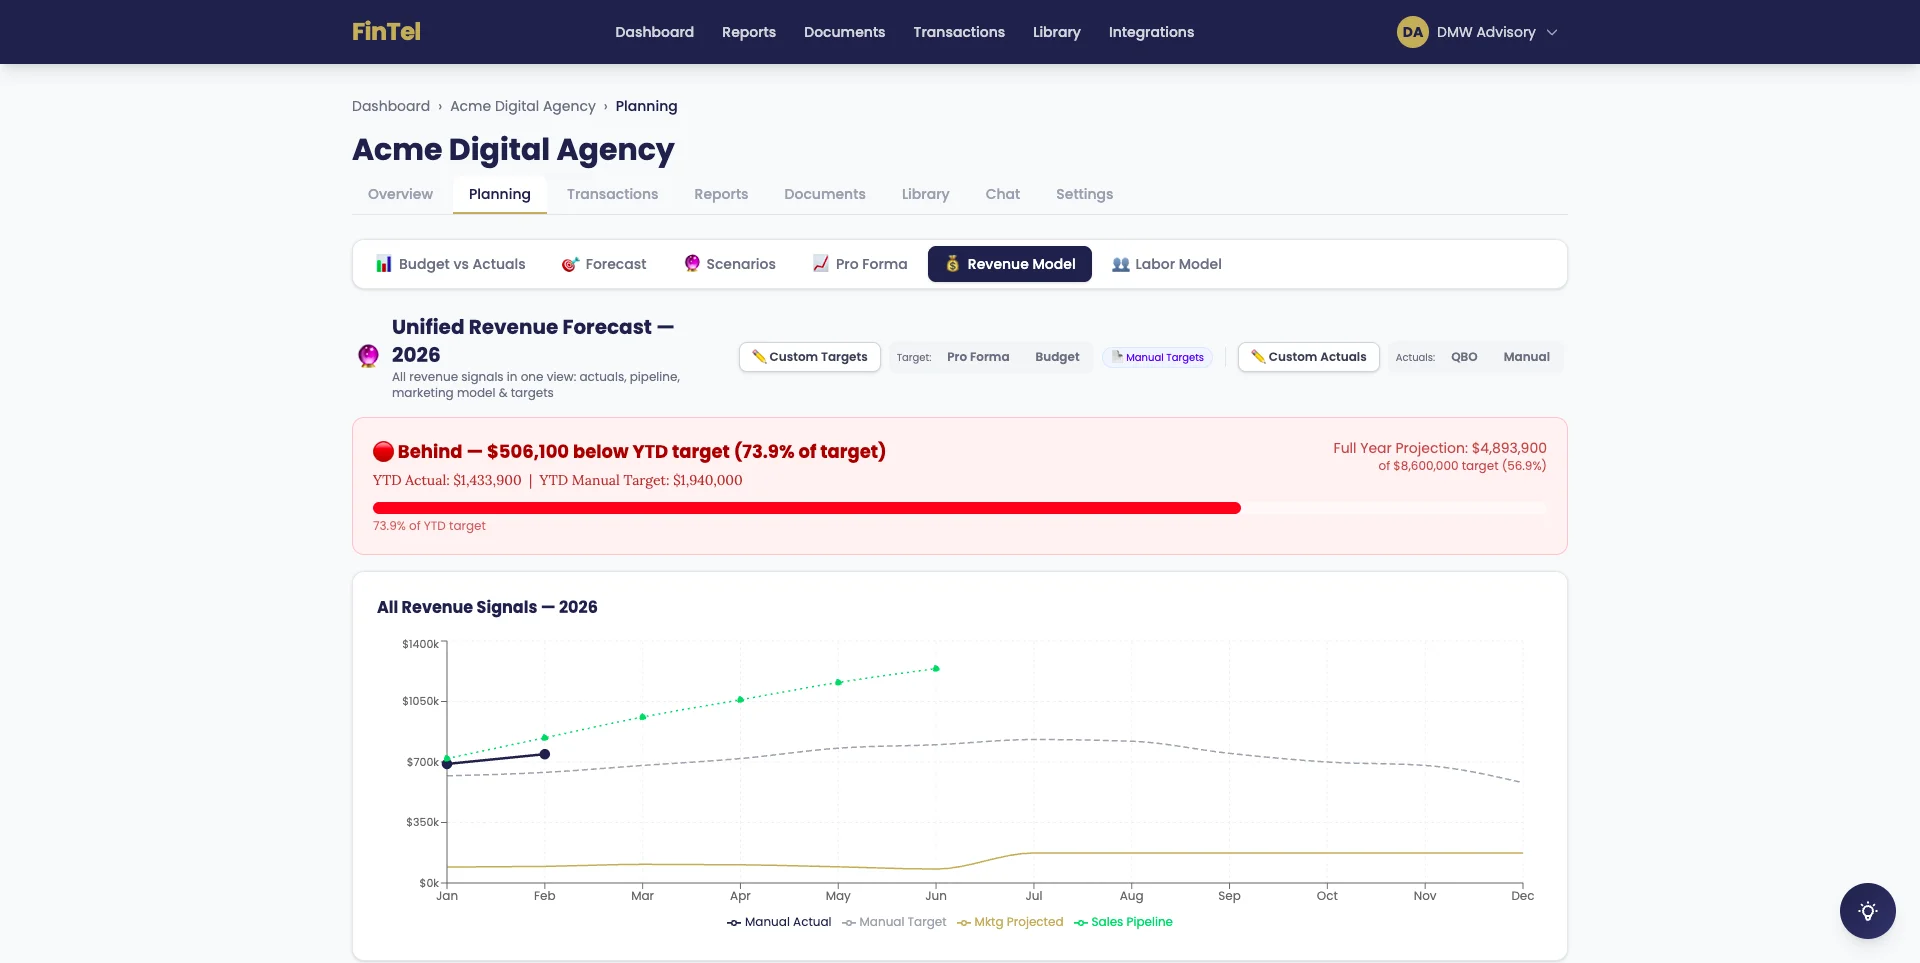
Pull revenue data from up to five inputs simultaneously: accounting platform actuals, CRM pipeline exports, contract schedules, historical trend models, and manual assumptions. Model by product line, customer segment, geography, or sales rep. The Revenue Model feeds directly into the three-statement forecast -- adjust your close rate assumption and see the cash flow impact immediately.
The most common CFO question is "what does hiring cost?" FinTel's Labor Model lets you add any role -- title, start date, base salary, bonus target, benefits load, and employer taxes -- and see the full-year cost impact on the income statement and cash runway, updated in real time. Model a hiring freeze, a reduction in force, or a phased hiring plan. Headcount planning becomes a structured model, not a back-of-napkin estimate.
Budget vs. Actuals analysis that generates automatically and visualizes variances as a waterfall chart -- starting from budget, stepping through each driver of the variance (revenue shortfall, COGS increase, SG&A overrun), and landing on the actual result. The AI writes the first-draft narrative. You edit. The waterfall chart is board-ready by default.
Optimistic, base, and pessimistic cash runway projections calculated continuously from the live forecast and actuals. See the date at which cash drops below your defined floor under each scenario. Drill into what's driving the difference between base and pessimistic: is it revenue timing, AP acceleration, or a capital expenditure? Share the three-scenario runway chart in board materials in one click.
Ask any financial question in plain English and get an answer sourced from your actual data. "What were our five largest expenses in Q1?" "How does our gross margin this year compare to last year by product line?" "Which customers account for more than 10% of revenue?" The AI has full access to transaction-level detail, KPIs, forecasts, and uploaded documents -- and it cites its sources so you can verify before presenting to the board.
Generate a comprehensive Excel workbook with the three-statement model, BvA analysis, scenario comparison, KPI summary, labor schedule, debt schedule, and supporting revenue detail -- complete with live formulas and embedded charts. For board members or lenders who want to work in Excel, you're handing them a model, not a static snapshot.
Branded, formatted financial reports designed for board presentation. Include the narrative, key KPIs, three-statement summary, scenario comparison, and charts -- all in one document that looks like your finance team spent a day on it. Adjust the template once to match your brand; from that point forward, reports generate in minutes.
Upload your annual budget, lender documents, investor agreements, prior audit reports, or any financial reference document -- and FinTel extracts and indexes the data. The AI can answer questions about document content, and uploaded budgets automatically refresh the BvA analysis. Stop treating documents as filing artifacts and start treating them as financial inputs.
Over 70 pre-calculated financial KPIs available immediately upon connection: gross margin, EBITDA margin, operating leverage, working capital ratio, DSO, inventory turnover, quick ratio, customer concentration, and more. Organized by category, comparable period-over-period, and visualizable in the Chart Library. Build your custom KPI dashboard for the board in minutes.
See how DMW FinTel transforms a typical board prep week -- from BvA review through scenario modeling, covenant monitoring, and final report delivery.
Open the BvA module. Q1 actuals just synced. Revenue came in at $4.1M against a $4.6M budget -- $500,000 unfavorable. EBITDA missed by $310,000. The variance waterfall chart auto-generates, breaking down the gap by category: revenue shortfall ($500K), partially offset by a $190K SG&A underspend. The AI has already drafted a narrative: "Q1 revenue came in 11% below plan, driven primarily by two enterprise deals that slipped to Q2. SG&A was favorable due to delayed hiring of two open roles." You edit the draft, add context on the slipped deals, and the BvA section of the board deck is done.

Open Scenario Planning. Create a new scenario: "Client Concentration Risk -- Top Client Exits." Remove the top client's $960,000 annual contract from the Revenue Model. The three-statement forecast recalculates instantly. EBITDA goes negative in Q3. Cash runway in the pessimistic scenario hits the $500,000 floor in late September. You now have a real answer to the question the board will ask -- and two counter-scenarios ready.
Create "Mitigation -- Freeze 3 Open Headcount." Remove three planned Q2 hires from the Labor Model. Cash runway in the same scenario extends to February. Create "Mitigation -- Accelerate Pipeline." Pull two Q3 enterprise deals into Q2 in the Revenue Model at 70% probability. Cash floor risk disappears entirely if both close. You have three named scenarios ready to present: base case, risk case, and two mitigation paths. Total time: 40 minutes.
Open the Revenue Model. Connect the updated CRM export your sales team uploaded this morning. FinTel parses the pipeline and maps deals to revenue quarters. Current pipeline covers $3.2M of the $4.8M Q2--Q4 target -- a $1.6M gap. Drill in: the gap is concentrated in the Enterprise segment, where the average sales cycle is 90 days. Three deals in early-stage negotiation would need to close within 45 days to hit the number. Flag this in the board materials with the pipeline chart.
Open the Debt Schedule. The company's term loan requires a minimum DSCR of 1.25x and a minimum cash balance of $750,000. Current actuals: DSCR is 1.31x -- safe. Cash balance is $1.2M -- safe. In the "Client Concentration Risk" scenario, cash drops to $680,000 in September, triggering a potential covenant breach. Flag it: "Risk scenario puts us below the minimum cash covenant in Q3. Mitigation required if client exits." That's a board conversation, not a spreadsheet footnote.
Run Excel Export. FinTel generates a 10-sheet workbook: three-statement model, BvA with waterfall, scenario comparison, KPI summary, labor schedule, debt schedule, revenue model by segment, and Q1 variance detail. Formulas are live. Charts are embedded. One analyst spends 30 minutes reviewing it for accuracy. Previously, building this package took two analysts three days.
Open AI Chat: "What were our five largest operating expenses in Q1 and how do they compare to Q1 of last year?" Response in 9 seconds: payroll +14%, software licenses +22%, travel +8%, rent flat, professional services -11%. Add it to the board narrative. "Which three customers represent more than 5% of revenue?" Response with names and percentages. Add it to the concentration risk slide.
Run Board Report Generation. Branded, formatted, 14 pages. The board receives a link to the report in their portal. Three of them log in before end of day and leave comments. The CFO responds from the same portal. No version confusion, no "which PDF is the latest," no email chains.
"DMW FinTel gives you the three-statement planning suite, AI analyst, and board-ready reporting that Mosaic and Datarails promise -- at a fraction of the cost, deployed in days, and smart enough to answer your CEO's next question before you've finished your coffee."
Join finance leaders already building board-ready packages in hours, not days.
Request Beta Access Back to Features →